Roaming Dashboard: Enhancing Wireless Performance and Troubleshooting





 Zyxel Employee
Roaming Dashboard Overview
The Roaming Dashboard is a powerful diagnostic tool designed to provide users with a comprehensive overview of roaming-related issues encountered by wireless clients. By summarizing key roaming events, it helps administrators quickly identify abnormal behaviors and network performance bottlenecks.
Key Features
- Event Summarization: Tracks the number of roaming events, failures, and specific roaming times.
- Signal Analysis: Monitors RSSI changes before and after roaming.
- Success Rate: Calculates an overall roaming success rate for the site.
Requirements and Location
This feature requires compatible AP models running firmware version 7.40 or later. It is located within Nebula at Site-wide > Monitor > Access points > Roaming dashboard, positioned between the WiFi Aid and Summary Report sections.
Diagnostic Tabs
The dashboard is organized into three primary tabs to streamline troubleshooting:
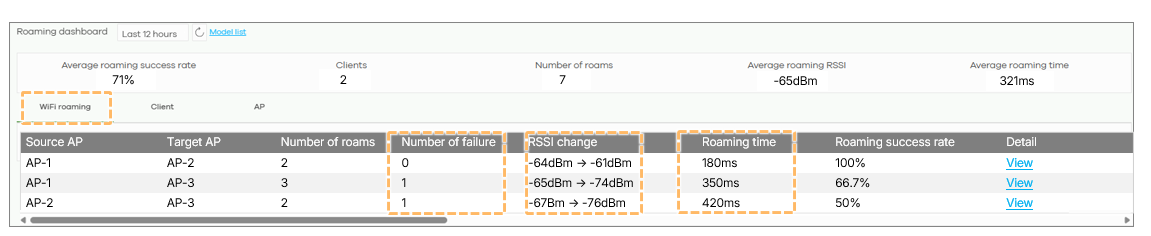
- Wi-Fi Roaming Tab: Helps identify problematic roaming paths (e.g., AP1 to AP3) by comparing success and failure counts.
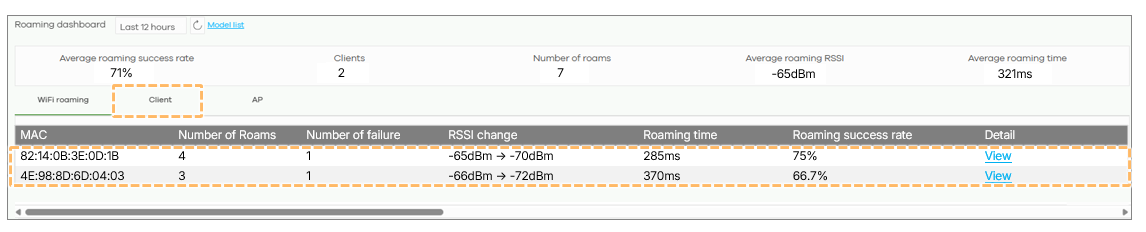
- Client Tab: Determines if roaming issues are isolated to specific client devices.
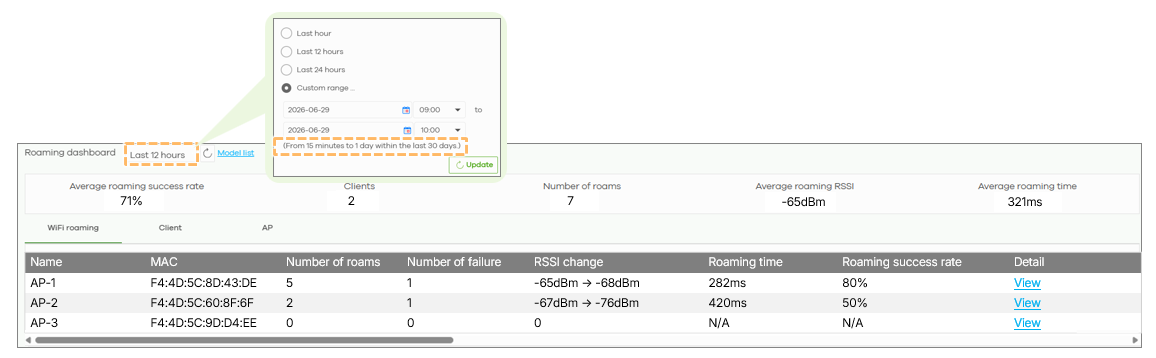
- AP Tab: Analyzes the performance of specific Access Points as either source or target nodes during a roam.

Operational Tips
Administrators can configure the time range for data display, ranging from 15 minutes to 30 days. Common troubleshooting actions include adjusting AP placement to ensure sufficient coverage overlap between roaming nodes.


Categories
- All Categories
- 442 Beta Program
- 3.1K Nebula
- 241 Nebula Ideas
- 6.8K Security
- 755 USG FLEX H Series
- 380 Security Ideas
- 1.8K Switch
- 87 Switch Ideas
- 1.5K Wireless
- 58 Wireless Ideas
- 7.2K Consumer Product
- 321 Service & License
- 512 News and Release
- 99 Security Advisories
- 31 Education Center
- 10 [Campaign] Zyxel Network Detective
- 5.3K FAQ
- 34 Documents
- 90 About Community
- 119 Security Highlight