USG60 Slow speed and perfomance .
We have Internet over pptp 100MB.
Optical converter with internet directly connected to WAN1 USG60
Some clients connected to LAN1 (1-2 clients) other clients to Lan2 (Squid). All Ports 1G.
If i connect to internet without USG (1 active client and no other) :
If i connect to internet using USG (1 active client and no other) :
if change server for testing , we have same results.
Dashboard screenshot with active services and firmware.
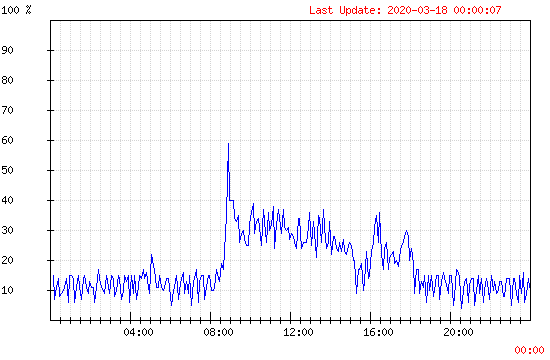
With default firmware processor load 90-100% (1 active client), with latest official firmware same result.
I will give below some screenshot with statistic (Active clients on LAN2)
CPU
WAN1
LAN2
Sessions
Active antivirus only for POP3 connection (1 connection to provider)
IDP active only to 1 Service (1 security rule)
Content Filtering active only on LAN2, No Https check.
tracert and ping gateway without без USG :
Tracing route to "gate" over a maximum of 30 hops
1 <1 ms <1 ms <1 ms "router"
2 1 ms <1 ms 1 ms "gate"
Pinging "gate" with 32 bytes of data:
Reply from "gate": bytes=32 time=1ms TTL=63
Reply from "gate": bytes=32 time=5ms TTL=63
Reply from "gate": bytes=32 time<1ms TTL=63
Reply from "gate": bytes=32 time=1ms TTL=63
tracert и ping gateway using USG
Tracing route to "gate" over a maximum of 30 hops
1 <1 ms <1 ms <1 ms "router"
2 <1 ms <1 ms <1 ms usg
3 48 ms 239 ms 353 ms "gate"
Pinging "gate" with 32 bytes of data:
Reply from "gate": bytes=32 time=229ms TTL=63
Reply from "gate": bytes=32 time=400ms TTL=63
Reply from "gate": bytes=32 time=30ms TTL=63
Reply from "gate": bytes=32 time=25ms TTL=63
If reconnect LAN1 to router or users switch, we have same results
If try download some Iso image without USG, we have 8-9 MBytes in sec, if i use USG connection - 1-3 MBytes in sec.
Start or off UTM services no change to perfomance
After connect users, not comfortable use youtube or download files. Its very slow/
Need help from Zyxel GURU .
All Replies
-
Hi @Pavel
Can you try to upgrade to the latest firmware 4.35(AAKY.3), and check it again if the symptom is still exist?
0 -
If i upgrade patch3 firmware, the device becomes very slow.
and had to flash wk10. on WK10 speed alittle more. But not does not reach maximum speed.
40-50 Mb.
I think that the device is not able to work on 100Mb. :(
0 -
Hi Pavel from the "System Resources" image you supplied, something(s) is/are consuming the CPU in the USG60
You can possibly get an idea by diagnosing the USG via the cli
Use a bash shell or similar and ssh into your USG60 and issue these commands at the very least :
- debug system show cpu all
- debug system
Router> debug system show cpu all ; debug system ps
The most obvious is where the softirq processes are consuming CPU% in the hgh 90's... -- this is merely data in or out and possibly CPU uses in crypto for VPN's you have active. ... refer next ...
Router> debug system show cpu all
CPU core 0 utilization: 12 % (system: 6 %, user: 3 %, irq: 0 %, softirq 3 %)
CPU core 0 utilization (1 minute): 8 % (system: 4 %, user: 2 %, irq: 0 %, softirq 2 %)
CPU core 0 utilization (5 minute): 10 % (system: 4 %, user: 2 %, irq: 0 %, softirq 4 %)
0 %, softirq 2 %)
CPU core 0 utilization (5 minute): 10 % (system: 4 %, user: 2 %, irq: 0 %, softirq 4 %)
This example USG40 is rather idle at present .
However , as an example or normal usage, when a series of long data transfers between remote networked hosts (zfs send | receive) started over two pairs of VTI tunnels the CPU goes to 85-90% for the duration of the data transfer .. most of this is sofirq.
The interesting one to review is the output from the debug system ps command .. Check the %CPU and see if there's anything there that has a somewhat subjective large number and report back.
Router> debug system ps
  PID PPID COMMAND USER TT PRI NI %CPU %MEM STAT VSZ RSS SZ SZ STARTED ELAPSED TIME COMMAND
 3091 1 zld_cloud_query root ? 19 0 0.0 0.2 Sl 540060 2728 532820 135015 Mar 23 1-02:48:58 00:00:11 /usr/sbin/zld_cloud_queryd
 4419 1 capwap_srv root ? 19 0 0.0 0.3 Sl 95996 3040 84508 23999 Mar 23 1-02:48:21 00:01:08 /usr/local/bin/capwap/capwap_srv -p /var/run/capwap_srv.pid
 ---snip---snip---snip---snip---snip---snip---snip

---snip---snip---snip---snip---snip---snip---snip
25338 6773 radiu <defunct> root ? 19 0 0.0 0.0 Z 0 0 0 0 14:43:44 40:28 00:00:00 [radiustorum] <defunct>
25671 2 kworker/u2:2 root ? 19 0 0.0 0.0 S 0 0 0 0 21:36:03 17:48:09 00:00:18 [kworker/u2:2]
Router>
Have a look yourself else post back in this thread for other to review and hopefully comment.
HTH
Warwick
Hong Kong
0 -
Thanx. i check this later , but on WK10 firmware no such processor load. It normal 8-16%.
0 -
Hi @Pavel
Can you type command below to check which service cause cpu high on the latest firmware?
Router> show cpu average
Router> debug system ps
Router> debug system show cpu all
0 -
Latest update WK11 increased speed up to 30%, change MTU increased download speed up to 5MB.
0
Categories
- All Categories
- 442 Beta Program
- 3K Nebula
- 223 Nebula Ideas
- 129 Nebula Status and Incidents
- 6.6K Security
- 628 USG FLEX H Series
- 353 Security Ideas
- 1.8K Switch
- 85 Switch Ideas
- 1.4K Wireless
- 54 Wireless Ideas
- 7K Consumer Product
- 299 Service & License
- 492 News and Release
- 92 Security Advisories
- 31 Education Center
- 10 [Campaign] Zyxel Network Detective
- 4.8K FAQ
- 34 Documents
- 88 About Community
- 108 Security Highlight
 Ally Member


 Zyxel Employee


