Topology - Visual Representation of Bandwidth
Options

SkyGoat
Posts: 43  Freshman Member


Freshman Member
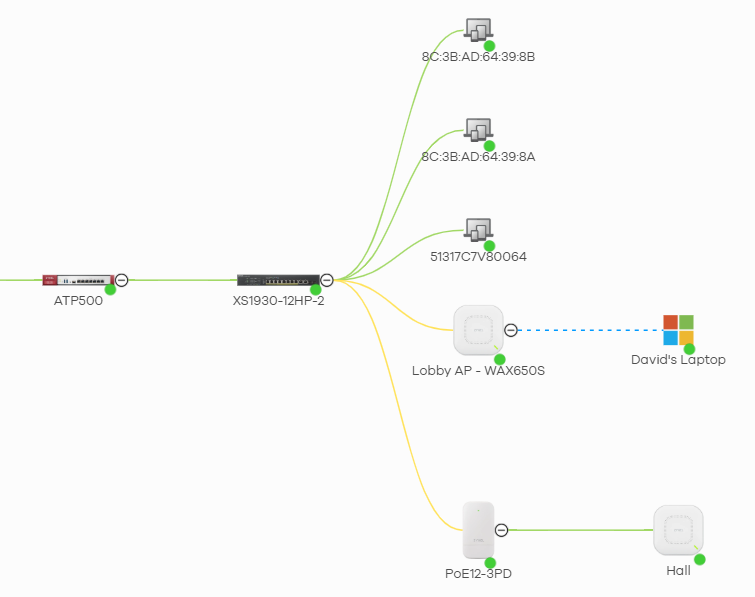
It would be good if the bandwidth flows between devices could be visually represented in some way on the Topology view.
e.g. Maybe the lines could get thicker, or a darker colour, or have some kind of animation, as more bandwidth is being consumed by the device
This would give an easy visual way to identify bandwidth hogging devices.
2
Comments
-
Hi @SkyGoat,
Thanks for your input! We'll be monitoring the votes and comments as part of our evaluation process.
If anyone likes this idea, please show your support by leaving a comment or voting for it.
Zyxel Tina
0

 Zyxel Employee


Categories
- All Categories
- 442 Beta Program
- 3.1K Nebula
- 234 Nebula Ideas
- 6.7K Security
- 695 USG FLEX H Series
- 366 Security Ideas
- 1.8K Switch
- 87 Switch Ideas
- 1.4K Wireless
- 56 Wireless Ideas
- 7.1K Consumer Product
- 312 Service & License
- 510 News and Release
- 97 Security Advisories
- 31 Education Center
- 10 [Campaign] Zyxel Network Detective
- 5.1K FAQ
- 34 Documents
- 89 About Community
- 114 Security Highlight

