Firewall status - High usage detail

 Master Member


Hello everyone,
is there a way to analyze what happens to a firewall when you see it under high usage?
For example, going from one ORG to another one I noticed this:
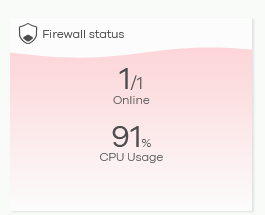
Is it possible to know why that firewall was over 90% of usage?
Just for your reference it stays on 5-10% as the average usage.
Accepted Solution
-
Hi @GiuseppeR
To analyze the CPU high issue, we need to dump the cup usage for each process to investigate. Below FAQ provides the steps to dump the required info for you to reference.
How to troubleshoot high CPU usage on USG FLEX H? — Zyxel Community
How to troubleshoot high CPU usage on ATP/USG FLEX? — Zyxel Community
Please help to collect and send it to me via private message.
Zyxel Melen0
 Zyxel Employee


All Replies
-
Hi @GiuseppeR
To analyze the CPU high issue, we need to dump the cup usage for each process to investigate. Below FAQ provides the steps to dump the required info for you to reference.
How to troubleshoot high CPU usage on USG FLEX H? — Zyxel Community
How to troubleshoot high CPU usage on ATP/USG FLEX? — Zyxel Community
Please help to collect and send it to me via private message.
Zyxel Melen0 -
Hi @Zyxel_Melen
in this moment it is in the average usage, if you want I can dump the data but I was referring to a possible tool inside Nebula to inspect what was happening. Is there something to see processes details?
0 -
-
0
-
Hi @GiuseppeR
The post from Cooldia is one of the command to check. You may check the post I mentioned in previous comment.
Zyxel Melen0 -
Hi @Zyxel_Melen
thanks a lot, I'll try that
0
Categories
- All Categories
- 442 Beta Program
- 2.9K Nebula
- 219 Nebula Ideas
- 127 Nebula Status and Incidents
- 6.5K Security
- 601 USG FLEX H Series
- 344 Security Ideas
- 1.7K Switch
- 84 Switch Ideas
- 1.4K Wireless
- 52 Wireless Ideas
- 7K Consumer Product
- 298 Service & License
- 480 News and Release
- 92 Security Advisories
- 31 Education Center
- 10 [Campaign] Zyxel Network Detective
- 4.8K FAQ
- 34 Documents
- 87 About Community
- 105 Security Highlight

